In the dynamic realm of the digital era, web designers and developers are constantly chasing innovation, seeking to captivate their audiences with visually stunning websites. And, data visualization is one of the most powerful tools for engaging audiences and conveying information effectively. This time, Essential Addons brings a Fancy Chart for Elementor to add stunning and dynamic charts to your website which has never been easier before.
![Introducing Fancy Chart For Elementor: Visualize Data With Dynamic Graphs [2026] 1 Fancy Chart For Elementor](https://essential-addons.com/elementor/wp-content/uploads/2023/11/image.png)
When it comes to crafting visually stunning websites, Elementor stands as one of the most popular page builders for WordPress. Essential Addons for Elementor, a powerhouse of widgets and extensions, has always been at the forefront of delivering cutting-edge features to power up Elementor. And now, it has introduced another exciting widget to make important data and graphs come to life in a way that looks visually stunning.
WordPress websites can be made much more appealing and important by using eye-catching graphs and stylish charts, and the Essential Addons Fancy Chart widget is a great way to do this. You will get a comprehensive tutorial on adding a Fancy chart in Elementor in this blog. But before we jump into the Fancy Chart, let us have a look below to know why you should consider showcasing data with dynamic graphs.
Why You Should Showcase Data With Dynamic Graphs
Visualizing data is not just a trend, it is a necessity. Whether you are running a blog, an e-commerce store, or a corporate website, presenting data in a compelling, easy-to-understand format can improve user engagement, boost user experience, and help your audience grasp complex information quickly. Here are a few reasons why dynamic graphs and charts are essential.
⭐ Enhanced User Engagement
Dynamic graphs have the remarkable ability to engage your audience like never before. Data presented in charts and graphs is more engaging and can keep your visitors on your site longer. Unlike static graphs, dynamic graphs allow users to interact with the data, enabling them to zoom in on specific details, change variables, and gain a deeper understanding of the information. This interactivity draws the viewer into the data story, making it more engaging and memorable.
⭐ Real-Time Updates And Insights
In a rapidly changing world, real-time data is invaluable. Dynamic graphs can be connected to live data sources, providing up-to-the-minute information and insights. Whether it is tracking stock prices or monitoring website traffic, dynamic graphs empower users to make informed decisions with the latest data. It enhances their ability to adapt to changing circumstances.
⭐ Enhanced Data Exploration And Discovery
Dynamic graphs facilitate data exploration by allowing users to slice and dice the information in various ways. They can toggle between different timeframes, filter data by categories, and even create their own custom views. This capability encourages your site visitors to discover hidden patterns, trends, and correlations that might otherwise remain concealed in static representations, leading to more informed decision-making and improved problem-solving.
Essential Addons Brings Exclusive Widget For Elementor
Essential Addons for Elementor offers a collection of widgets that extend the capabilities of the Elementor page builder. It has a wide range of elements, from dynamic content widgets to interactive elements, that you can easily integrate into your Elementor-designed web pages. This extraordinary Elementor Addons has brought an exclusive and incredibly powerful addition to its already impressive lineup – the Fancy Chart widget.
What Sets Fancy Chart For Elementor Apart: Creative Features
![Introducing Fancy Chart For Elementor: Visualize Data With Dynamic Graphs [2026] 2 Fancy Chart For Elementor](https://essential-addons.com/elementor/wp-content/uploads/2023/11/image-1.png)
The Fancy Chart widget of Essential Addons is designed to help you create dynamic and visually appealing charts and graphs effortlessly. Have a look below and see what makes the Essential Addons’ Fancy Chart widget stand out.
- Intuitive Design: The user-friendly interface of Essential Addons Fancy Chart lets you create complex graphs with just a few clicks.
- Multi-Type Of Charts: You can visualize data with different types of dynamic graphs such as Bar charts, Area charts, Line charts, Radar charts, Pie charts, Donut charts, and Polar charts.
- Easy Data Import: Besides static data, you can import data in your charts directly to data sources like Google Sheets, CSV, JSON files, etc making it easy and accurate.
- Customization Options: Fancy Chart offers extensive styling options so you can match the chart’s appearance to your website’s design.
3-Step Guide: How To Use Fancy Chart Of Essential Addons
The Essential Addons Fancy Chart is an exceptional tool for enhancing your website with interactive charts and graphs, allowing you to present essential data in a visually engaging manner. This premium widget of Essential Addons, breathes life into your datasets, making them easy for your website visitors to comprehend. With this widget, you can effortlessly emphasize data using dynamic, eye-catching charts in Elementor, all without the need for coding. Let us have a look at this step-by-step guide to add data charts to your website using the Fancy Chart Widget in Elementor.
Step 1: Activate The Fancy Chart Widget
Fancy Chart is a premium widget. So, before you begin, ensure that both the Free and PRO versions of Essential Addons are installed and activated on your website. Now, from your WordPress dashboard, go to the Essential Addons and move to the ‘Elements’ tab. Scroll down and turn the toggle on to enable the ‘Fancy Chart’ widget from the ‘Creative Elements’ section. Click on the ‘Save Settings’ button afterward.

Step 2: Configure The Fancy Chart Widget
Open the page where you want to insert your data chart. Then, search ‘EA Fancy Chart’ in the Elementor’s widget search panel. Simply drag & drop the widget where needed. From the ‘Content’ tab under the ‘General’ section in the widget customizer side panel, add the ‘Chart Title’ and ‘Chart Description’. After that, choose ‘Chart Style’, and ‘Chart Orientation’ from the ‘Settings’ section.
In the ‘Advanced Settings’ section, you will have options to show/hide the Toolbar, adjust Data Position, Legend Position, etc. From the ‘Data’ section, choose the ‘Data Source’. By default, the ‘Static’ option will be selected with which you have to insert your chart data manually. You can also insert your chart data from CSV, JSON, or any Google Sheets and modify them as you want.

Step 3: Style The Fancy Chart To Match Your Site
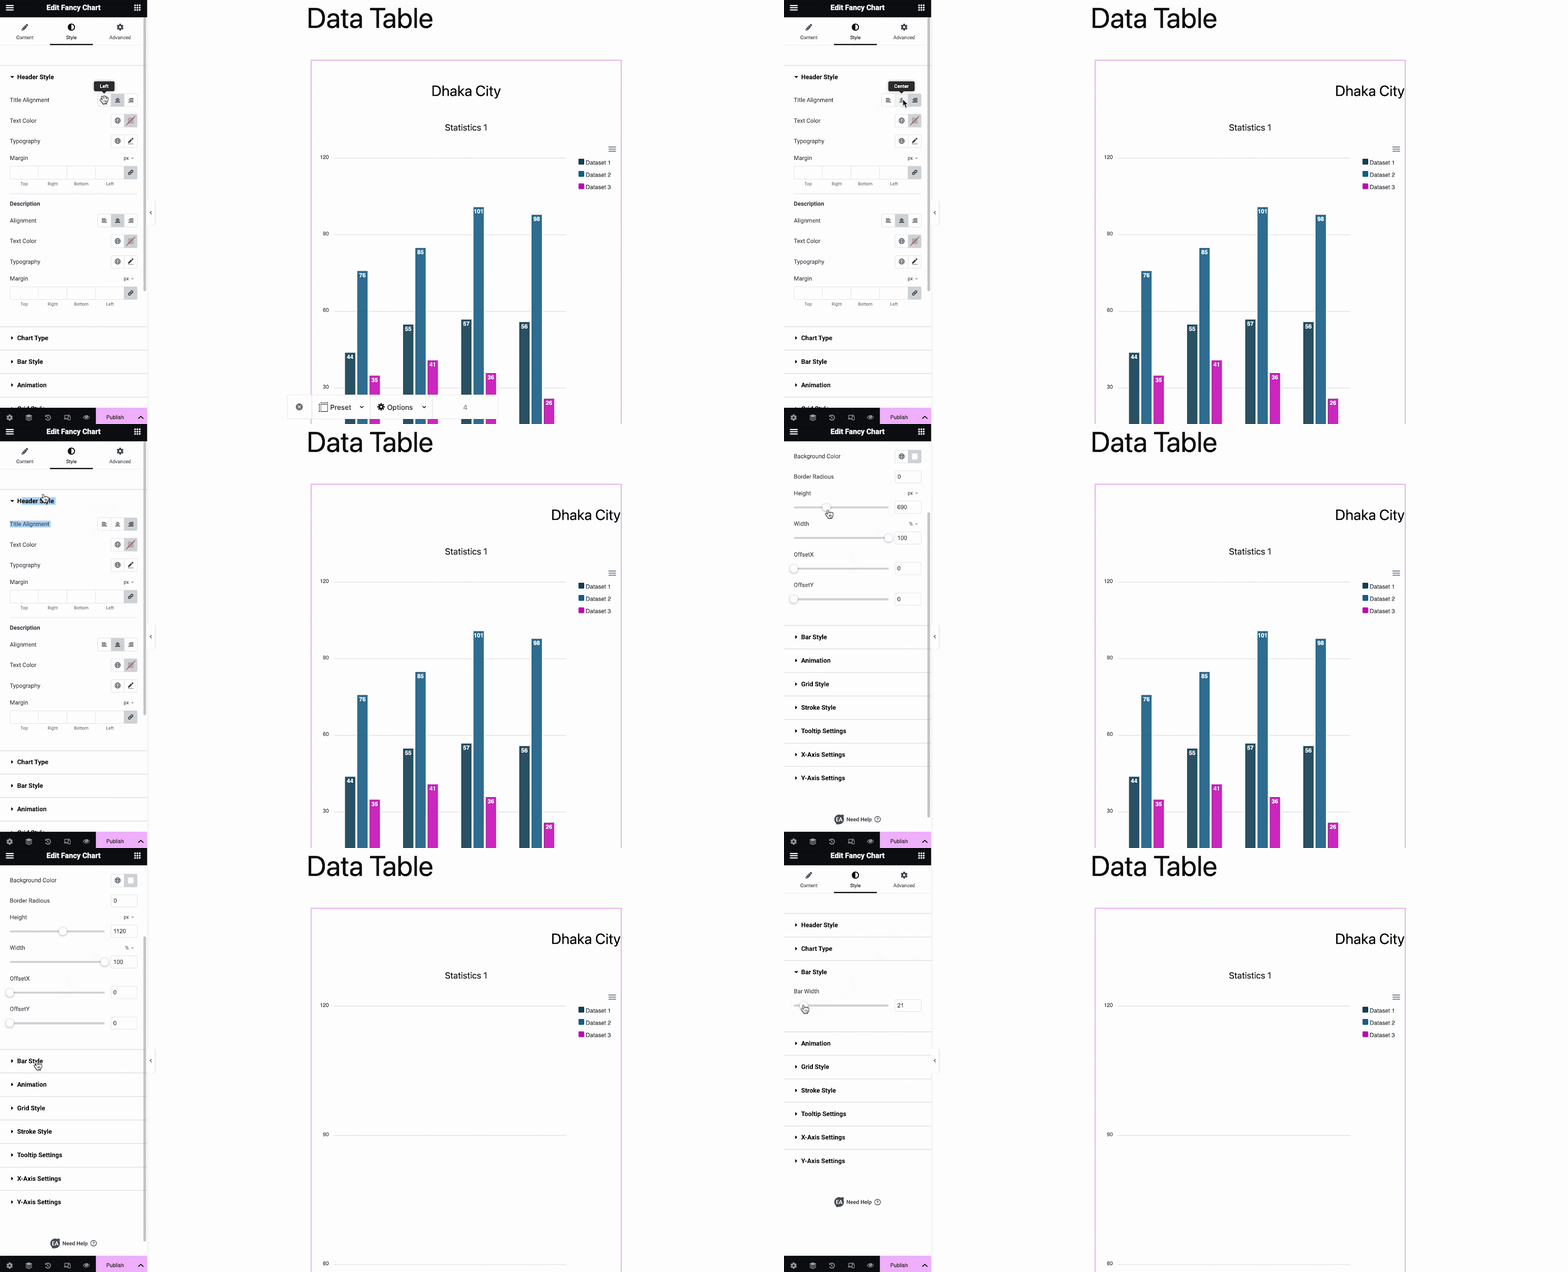
From the ‘Style’ tab you will find the options to customize your data chart appearance. From the ‘Header Style’, change the alignment, text color, typography, etc. From the ‘Chart Type’ section, adjust the background color, height, width, etc. From ‘Bar Style’, change the ‘Bar Width’ as required. There are multiple styling options available in the ‘Style’ tab. You can play around with the versatile customization options to get the desired outlook of the chart.

Thus you can easily add a Fancy Chart to your website with Essential Addons to showcase dynamic graphs. For a more detailed walkthrough and step-by-step tutorial, you can check out this documentation on Fancy Chart.
Time To Design Website With Fancy Chart
Essential Addons for Elementor, with its innovative Fancy Chart widget, empowers web designers and developers like you to showcase data with dynamic graphs, elevating user engagement and enhancing the overall user experience. As we venture further into 2024, the fusion of Essential Addons for Elementor and the Fancy Chart widget paves the way for more engaging, data-driven web content. It is time to step up your web designing and explore the possibilities of visualizing data like never before.
Do you think this article is helpful? If you like this, then subscribe to our blog for more articles. You can have a look at this Essential Addons Documentation Page for instructions regarding other cool widgets of Essential Addons. Also, join us on our Facebook community to interact with your fellow Essential Addons users.


![[New Extension] How to Show Vertical Text on Elementor Websites?](https://essential-addons.com/wp-content/uploads/2025/11/Essential-Addons-New-Extension-Vertical-Text-Orientation-1024x576.jpg)


